The world’s most stressful cities

We discover the 33 most stressful cities in the world

City life influences our everyday life.

Despite major advancements in public transport and urban planning, city life can be exceptionally stressful. There are a huge range of factors that either contribute or ease the burden of everyday urban life, such as the average working hours, the cost of rent, and the hours of sunshine. At Baufi24, we’re proud to be part of the new wave of digitisation that aims to make city life easier. With 68% of the world’s population predicted to live in urban areas by 2050, this study aims to highlight the urgent need for cities to adapt and innovate to meet the demands of their rapidly growing populations (United Nations, 2018).

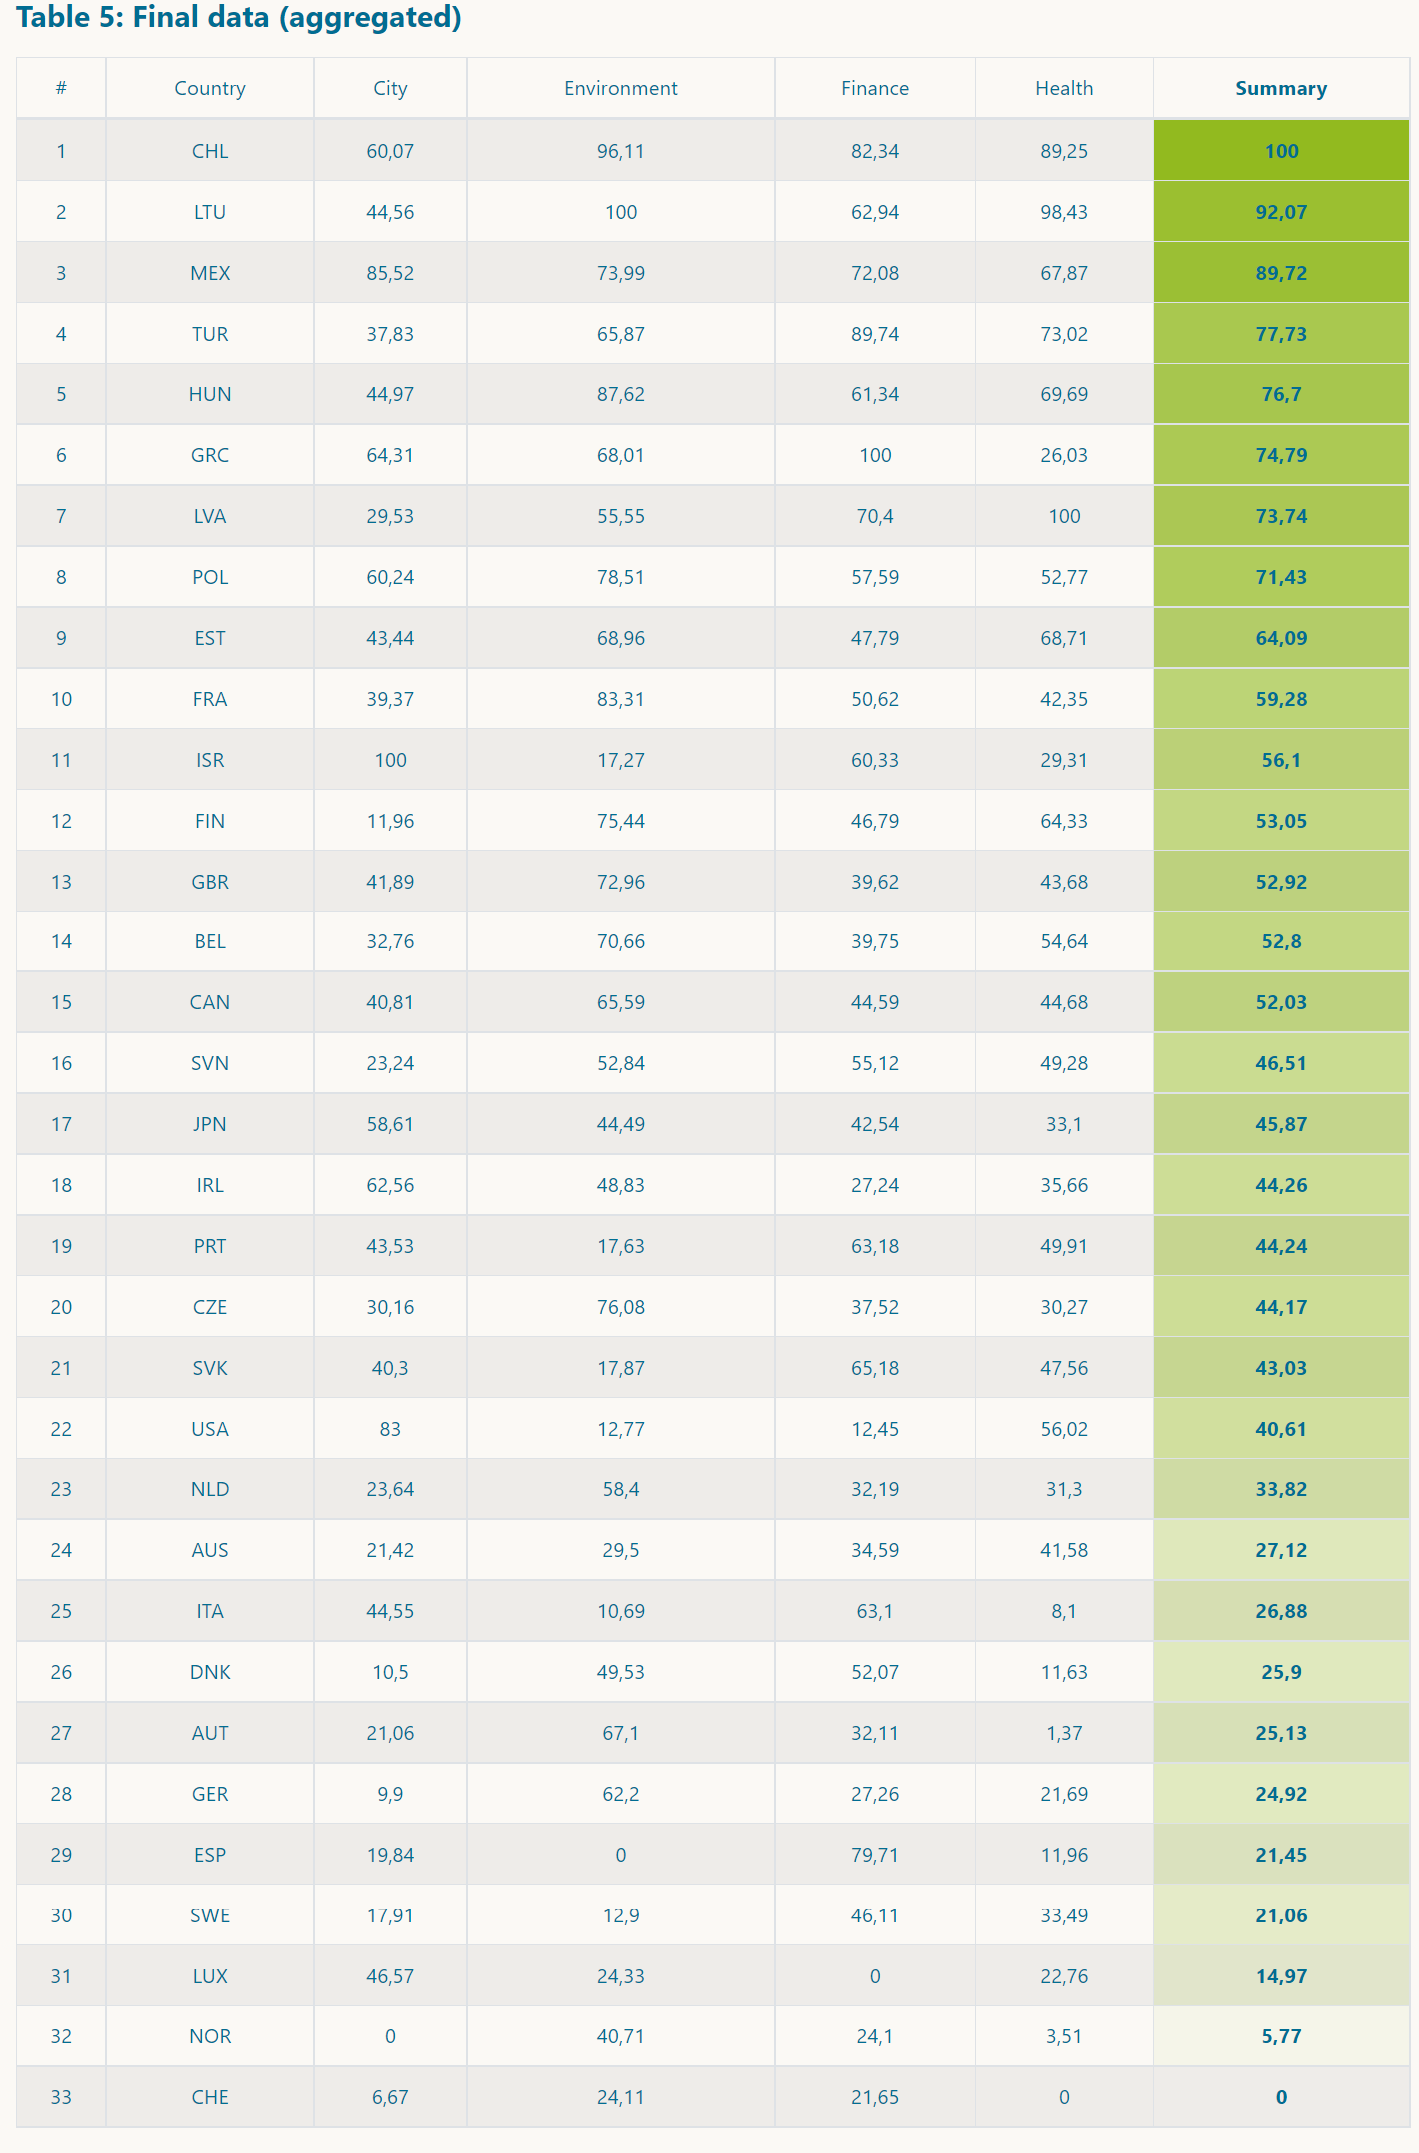
This study analyses 33 capital cities in the OECD for a range of factors across four categories: City, Environmental, Financial, and Health, to give a comprehensive overview of the various elements of city life that can affect our mental well-being. The factors range from levels of disposable income, unemployment rates, and suicide rates, to the number of doctors per capita, the levels of air pollution, and the percentage of available green space. Santiago ranks first as the most stressful city in the world, while London ranks 14th, ahead of Washington D.C. Tokyo, and Madrid, largely a result of a lack of available green space.

Inhalt:

Evaluation result

City Environment Finances Health
Rank Country City Final result Population Density Rent Traffic congestion Traffic accidents Working hours Sunshine hours Air pollution Green spaces Unemployment Gross Domestic Product Income Life expectancy Health expenditure Doctors Depression Suicide
1 Chile Santiago 100,00 71,73 10,44 77,14 0,00 68,82 49,22 100,00 78,24 37,00 95,22 100,00 43,73 88,95 100,00 69,91 37,16
2 Lithuania Vilnius 92,07 22,96 16,89 42,86 54,18 54,39 91,98 43,68 98,04 29,67 82,30 73,73 83,09 86,47 15,12 73,22 100,00
3 Mexico Mexico City 89,72 61,04 17,55 100,00 10,03 100,00 41,73 59,77 90,46 9,71 100,00 97,92 96,71 100,00 67,07 20,82 12,84
4 Turkey Ankara 77,73 1,09 0,00 42,86 78,27 53,06 35,27 43,68 100,00 76,76 89,58 83,64 71,06 99,06 80,73 56,79 0,00
5 Hungary Budapest 76,70 4,78 14,93 57,14 50,64 64,75 72,41 48,28 93,15 8,85 85,65 87,37 88,05 90,38 45,37 19,91 57,34
6 Greece Athens 74,79 24,11 11,57 74,29 54,67 73,58 34,10 59,77 88,51 100,00 89,06 85,52 30,66 88,36 14,39 74,87 6,42
7 Latvia Riga 73,74 0,34 12,11 28,57 56,74 57,79 83,56 36,78 42,05 27,77 88,72 87,10 100,00 93,54 48,05 48,32 71,10
8 Poland Warsaw 71,43 3,42 23,48 65,71 61,06 74,86 87,67 52,87 58,68 4,85 85,71 82,32 67,74 90,28 68,29 0,00 41,28
9 Estonia Tallinn 64,09 50,69 18,43 40,00 23,70 55,80 80,33 9,20 94,38 18,20 82,19 48,99 59,45 88,43 41,71 61,83 47,71
10 France Paris 59,28 8,57 51,38 62,86 38,35 17,78 87,96 40,23 78,73 39,61 72,43 44,11 17,67 59,50 44,15 77,49 48,17
11 Israel Jerusalem 56,10 100,00 41,88 94,29 23,99 62,89 0,00 11,49 89,49 9,51 78,53 91,41 14,78 82,62 49,76 61,19 12,84
12 Finland Helsinki 53,05 2,69 42,68 5,71 28,81 33,89 81,51 21,84 90,95 31,33 69,41 46,24 24,93 67,29 48,05 98,34 51,83
13 United Kingdom London 52,92 23,43 93,80 17,14 15,44 35,11 88,94 32,18 69,19 11,04 71,27 47,48 29,95 68,97 56,83 72,30 21,56
14 Belgium Brussels 52,80 6,00 35,1 60,00 41,00 21,13 92,12 40,23 54,28 21,33 66,62 42,15 27,44 59,72 51,22 71,90 61,01
15 Canada Ottawa 52,03 0,00 42,26 62,86 39,23 38,02 71,33 10,34 96,82 29,20 69,41 43,10 23,73 59,40 59,02 67,24 42,20
16 Slovenia Ljubljana 46,51 22,96 21,24 25,71 37,27 33,43 80,04 45,98 32,03 14,19 80,58 72,20 33,38 81,78 50,73 23,70 71,10
17 Japan Tokyo 45,87 43,41 45,04 71,43 22,12 42,67 78,18 50,57 15,89 2,51 73,53 60,75 0,00 61,60 67,07 42,21 57,80
18 Ireland Dublin 44,26 2,12 80,01 88,57 19,86 43,48 100,00 14,94 36,67 18,05 25,53 56,52 16,82 60,02 48,78 77,38 30,73
19 Portugal Lisbon 44,24 7,93 37,28 45,71 41,40 56,52 21,77 33,33 46,45 29,79 83,91 72,59 26,08 81,76 44,88 83,98 25,23
20 Czech Republic Prague 44,17 3,63 30,88 34,29 41,40 46,86 88,06 35,63 71,64 0,00 78,85 45,92 54,89 79,68 27,12 16,44 44,95
21 Slovakia Bratislava 43,03 23,25 22,53 54,29 37,66 43,43 69,77 32,18 0,00 24,74 83,67 82,67 73,90 87,80 42,93 5,86 46,79
22 United States Washington D.C. 40,61 3,61 100,00 34,29 100,00 44,76 42,42 0,00 51,34 12,17 52,48 0,00 59,50 0,00 62,68 100,00 51,83
23 Netherlands Amsterdam 33,82 10,01 74,38 25,71 23,01 8,45 88,36 28,74 49,88 8,78 60,15 43,05 25,70 56,07 38,40 68,72 36,24
24 Australia Canberra 27,12 0,71 53,26 0,00 40,41 41,90 31,95 9,20 79,46 21,63 66,34 29,75 15,34 59,07 36,59 91,81 42,66
25 Italy Rome 26,88 8,36 39,30 60,00 42,67 40,92 47,36 37,93 5,13 51,99 77,60 56,52 13,27 75,76 29,02 46,95 14,22
26 Denmark Copenhagen 25,90 6,59 60,3 14,29 23,99 5,16 82,58 31,03 39,12 18,92 61,36 79,36 30,00 55,96 28,78 40,28 31,19
27 Austria Vienna 25,13 2,56 36,29 31,43 36,38 28,76 77,15 25,29 78,48 14,99 61,41 35,38 26,93 54,94 0,00 39,09 44,95
28 Germany Berlin 24,92 2,45 37,94 42,86 25,66 0,00 89,92 34,48 48,66 7,24 64,53 28,38 33,76 48,68 22,68 66,12 34,86
29 Spain Madrid 21,45 10,38 42,02 17,14 26,06 36,91 35,62 22,99 14,67 81,54 78,24 66,14 9,20 76,88 31,71 49,82 19,27
30 Sweden Stockholm 21,06 2,81 55,73 28,57 12,49 28,34 73,14 18,39 2,44 34,16 63,90 47,29 17,82 54,39 31,71 86,55 38,99
31 Luxembourg Luxembourg City 14,97 1,47 72,04 54,29 49,95 18,31 96,92 8,05 7,33 25,46 0,00 9,33 22,20 58,38 53,66 52,89 21,10
32 Norway Oslo 5,77 0,82 55,63 14,29 7,57 7,06 88,06 20,69 29,83 9,83 51,04 31,72 14,67 46,56 8,78 58,85 41,28
33 Switzerland Berns 0,00 5,77 46,16 8,57 14,55 26,17 83,76 8,05 20,15 14,76 46,12 25,83 6,92 34,60 25,85 56,38 39,45

Methodology: The World’s Most Stressful Cities

This study ranks the capital cities of the countries in the Organisation for Economic Cooperation and Development to identify which urban populations are most exposed to stress. The cities were examined across a selection of fields of investigation, including ‘City’, ‘Environment’, ‘Finance’, and ‘Health’.

Due to a lack of data and in order to ensure comparability, the cities of Bogota (Colombia), Reykjavik (Iceland), Seoul (South Korea) and Wellington (New Zealand) were not included in the analysis.

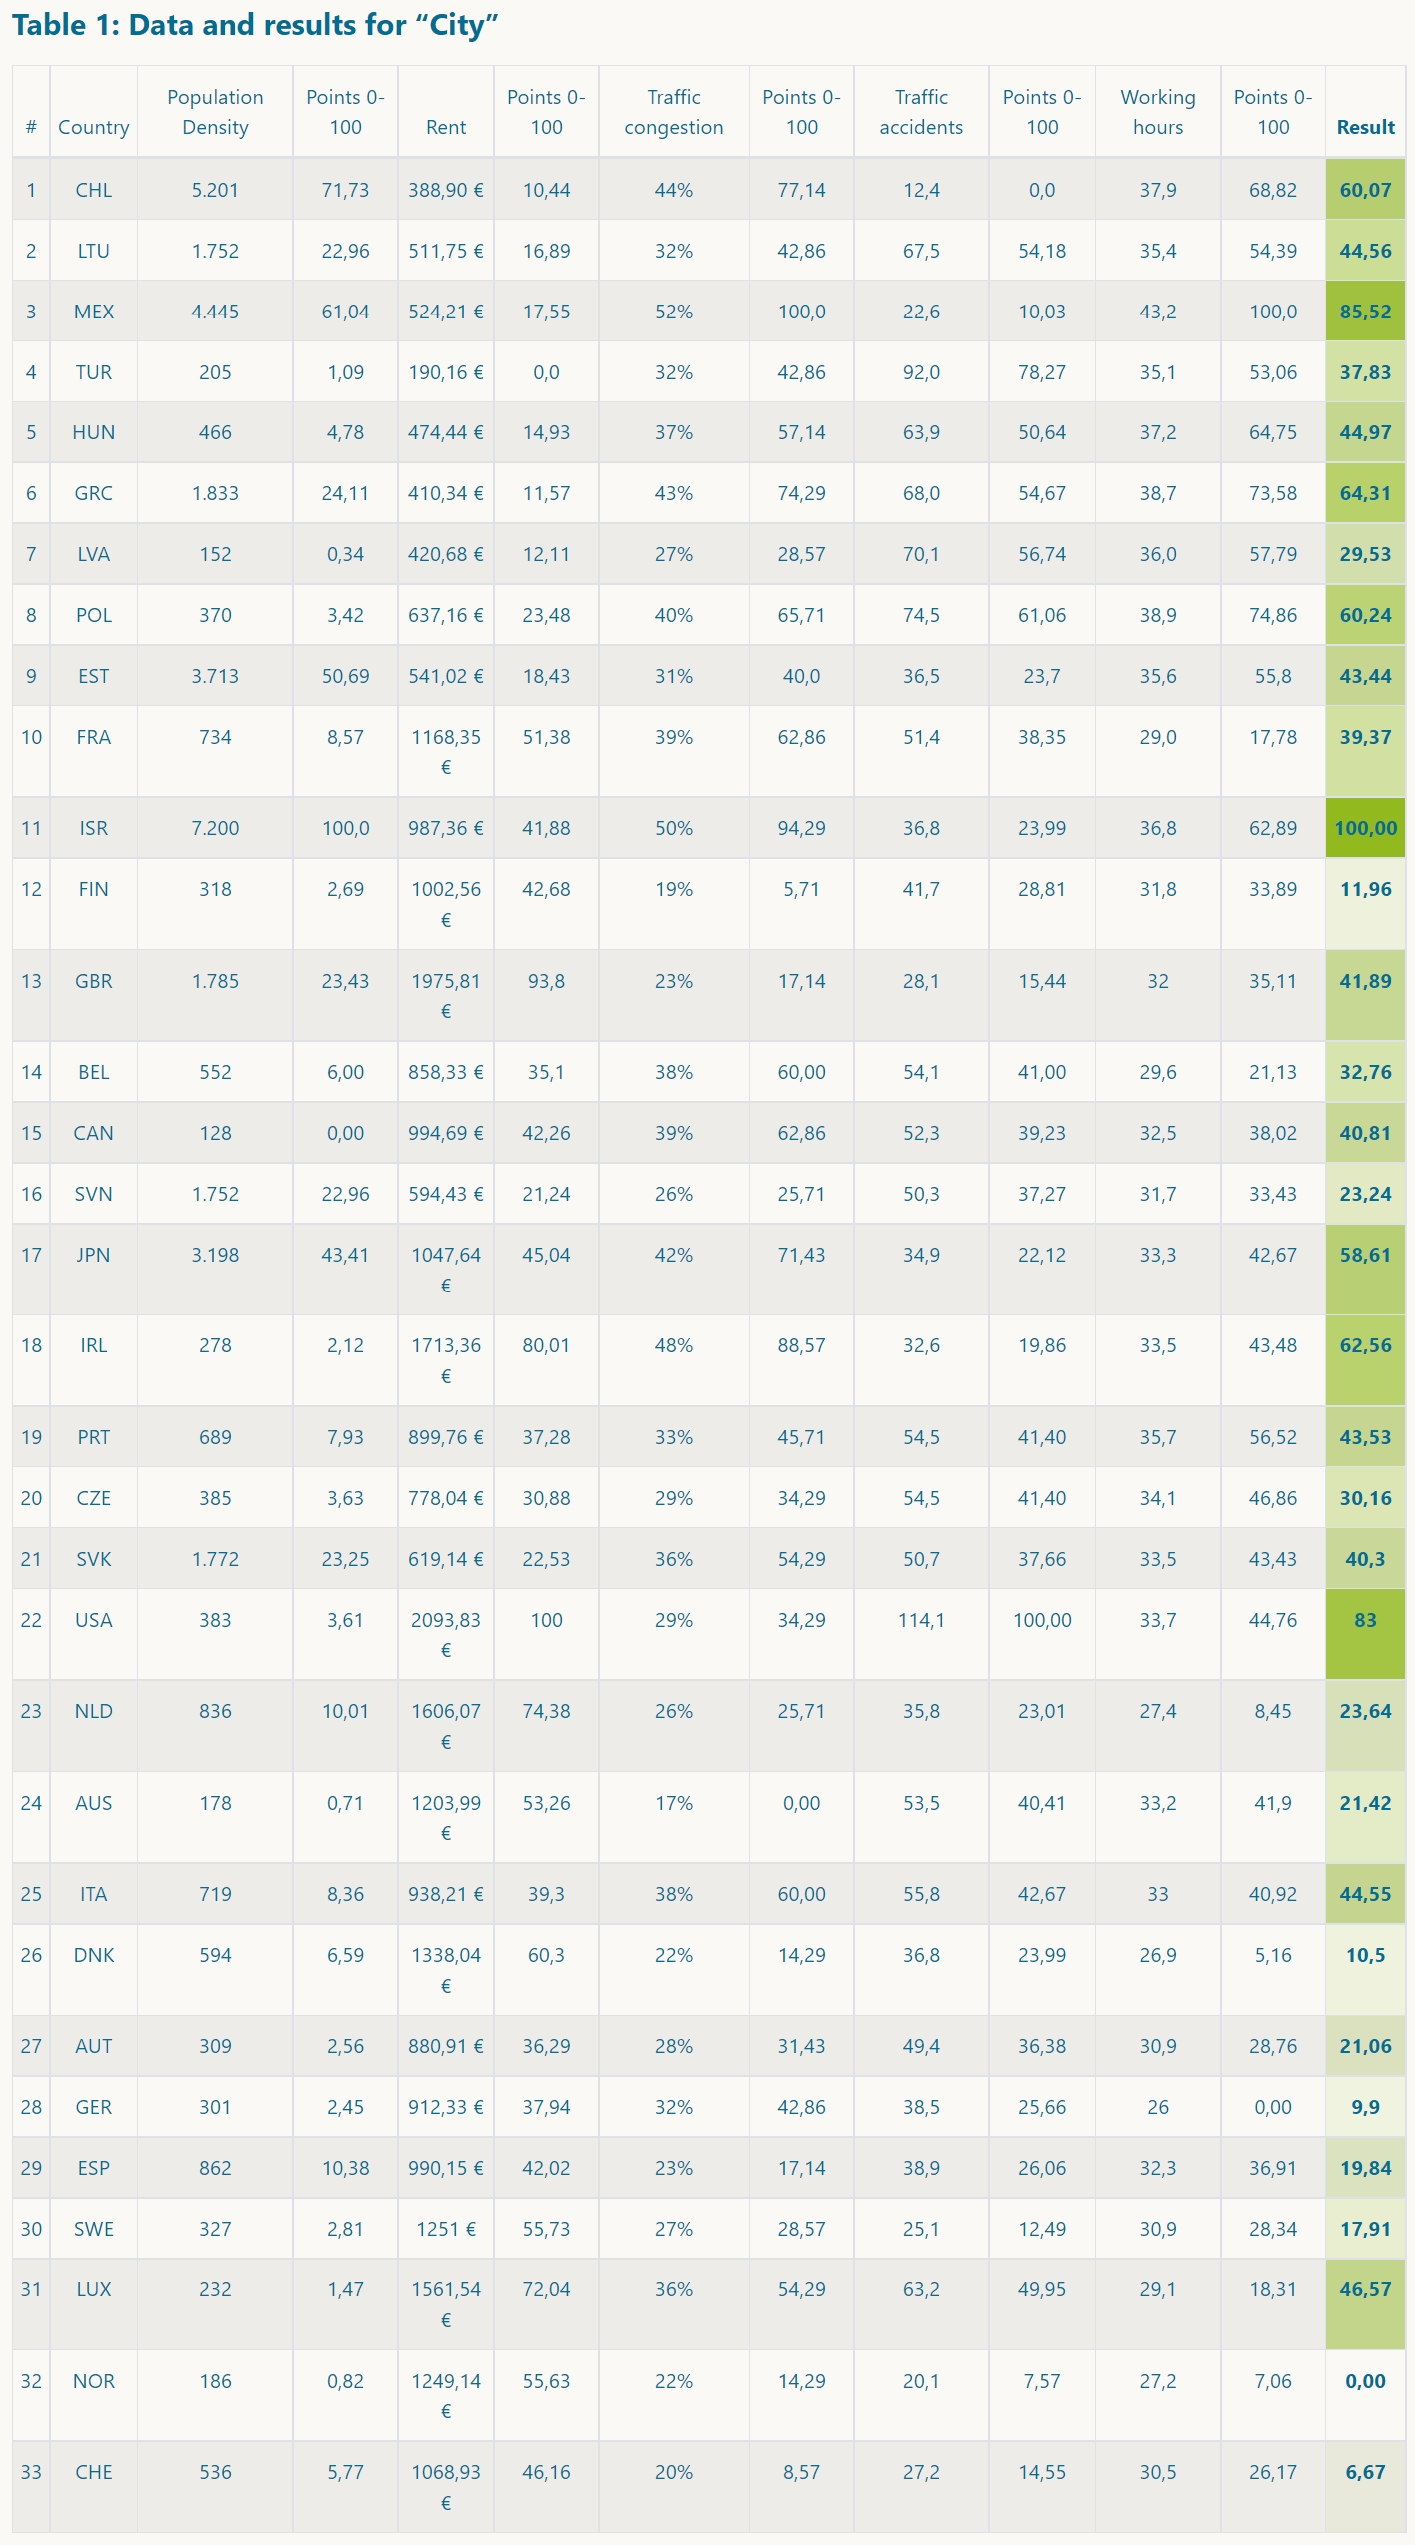
Field of Investigation 1: City


Population density

Population density and social interaction are proportional to each other. Thus, excessive demands on social interaction generate stress (see The Social Consequences of High Population Density – Halliman H. Winsborough). The information on the average population density of the city (inhabitants per km², 2018) was taken from the data portal OECD.stats.

Rental expenses

People who do not have access to affordable accommodation experience greater levels of stress due to the income required to manage the cost of living (see Housing stress and the mental health and wellbeing of families – Elly Robinson and Rennell Adams). The information on the average monthly rent for a one-room apartment in the city centre was taken from the Numbeo database.

Traffic congestion

High traffic congestion affects the stress level of drivers (See vgl. Bitkina, Olga Vl et al. “Identifying Traffic Context Using Driving Stress: A Longitudinal Preliminary Case Study.” Sensors (Basel, Switzerland) vol. 19,9 2152. 9 May. 2019). The percentage increase on journey time caused by heavy traffic and congestion was taken from the Tom Tom Traffic Index 2019.

Traffic accidents

Drivers under stress cause more accidents (see vgl. Taylor AH, Dorn L. Stress, fatigue, health, and risk of road traffic accidents among professional drivers: the contribution of physical inactivity. Annu Rev Public Health. 2006;27:371‐391). The data on the number of road traffic accidents per 100,000 inhabitants was taken from the statistics "Road injury accidents" on the data portal OECD.stats from the year 2018.

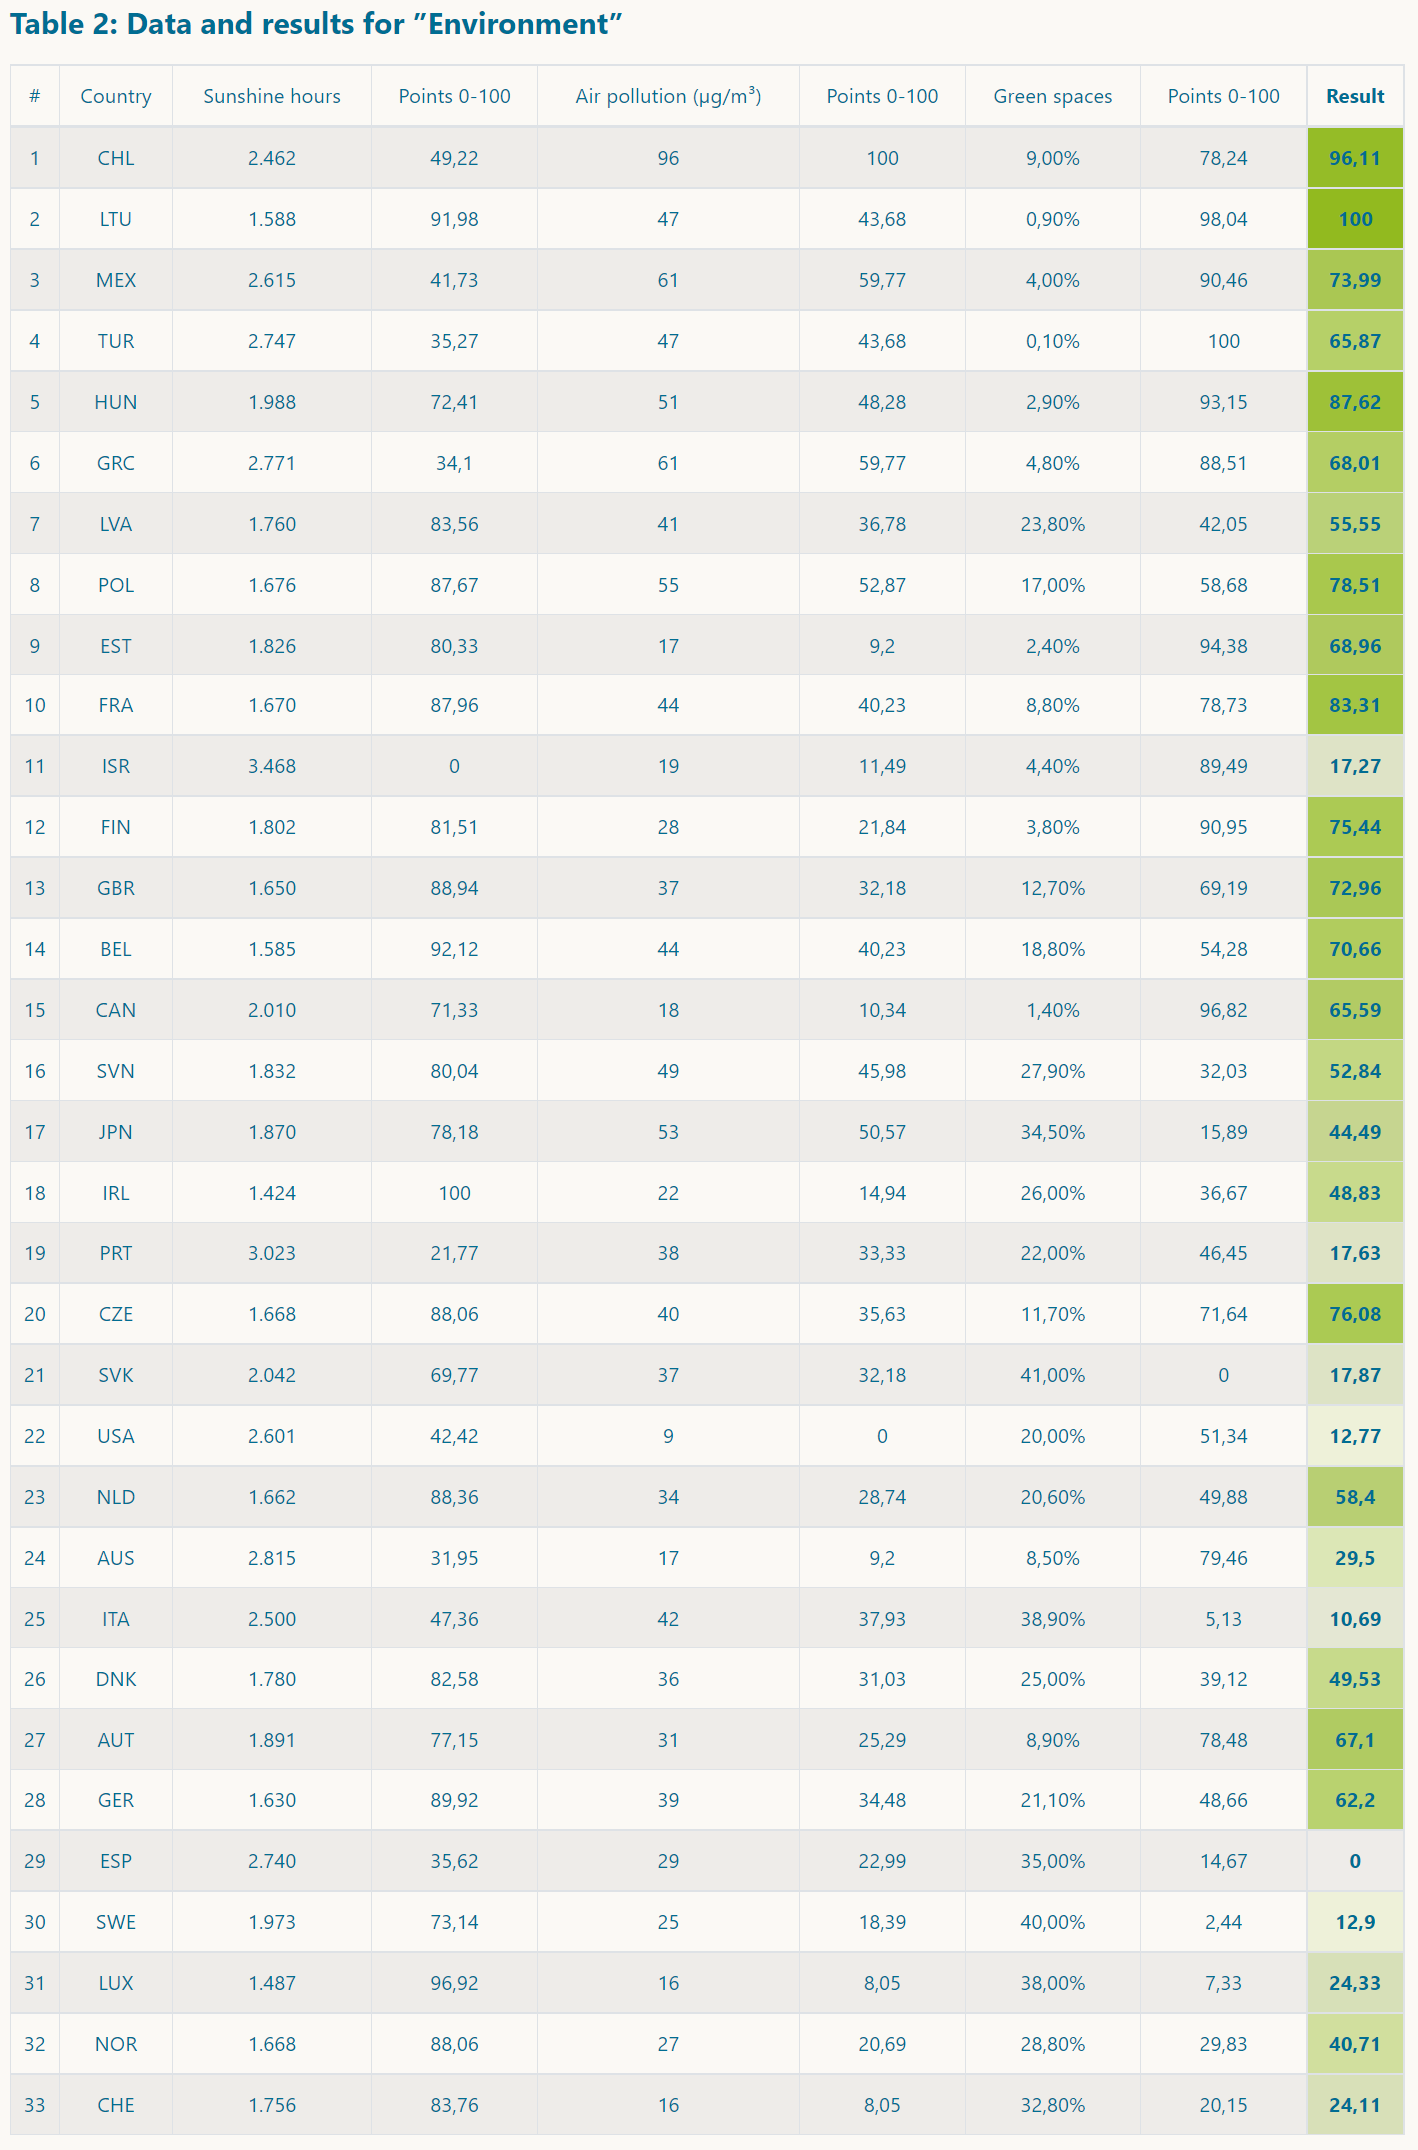
Field of investigation 2: Environment


Sunshine hours

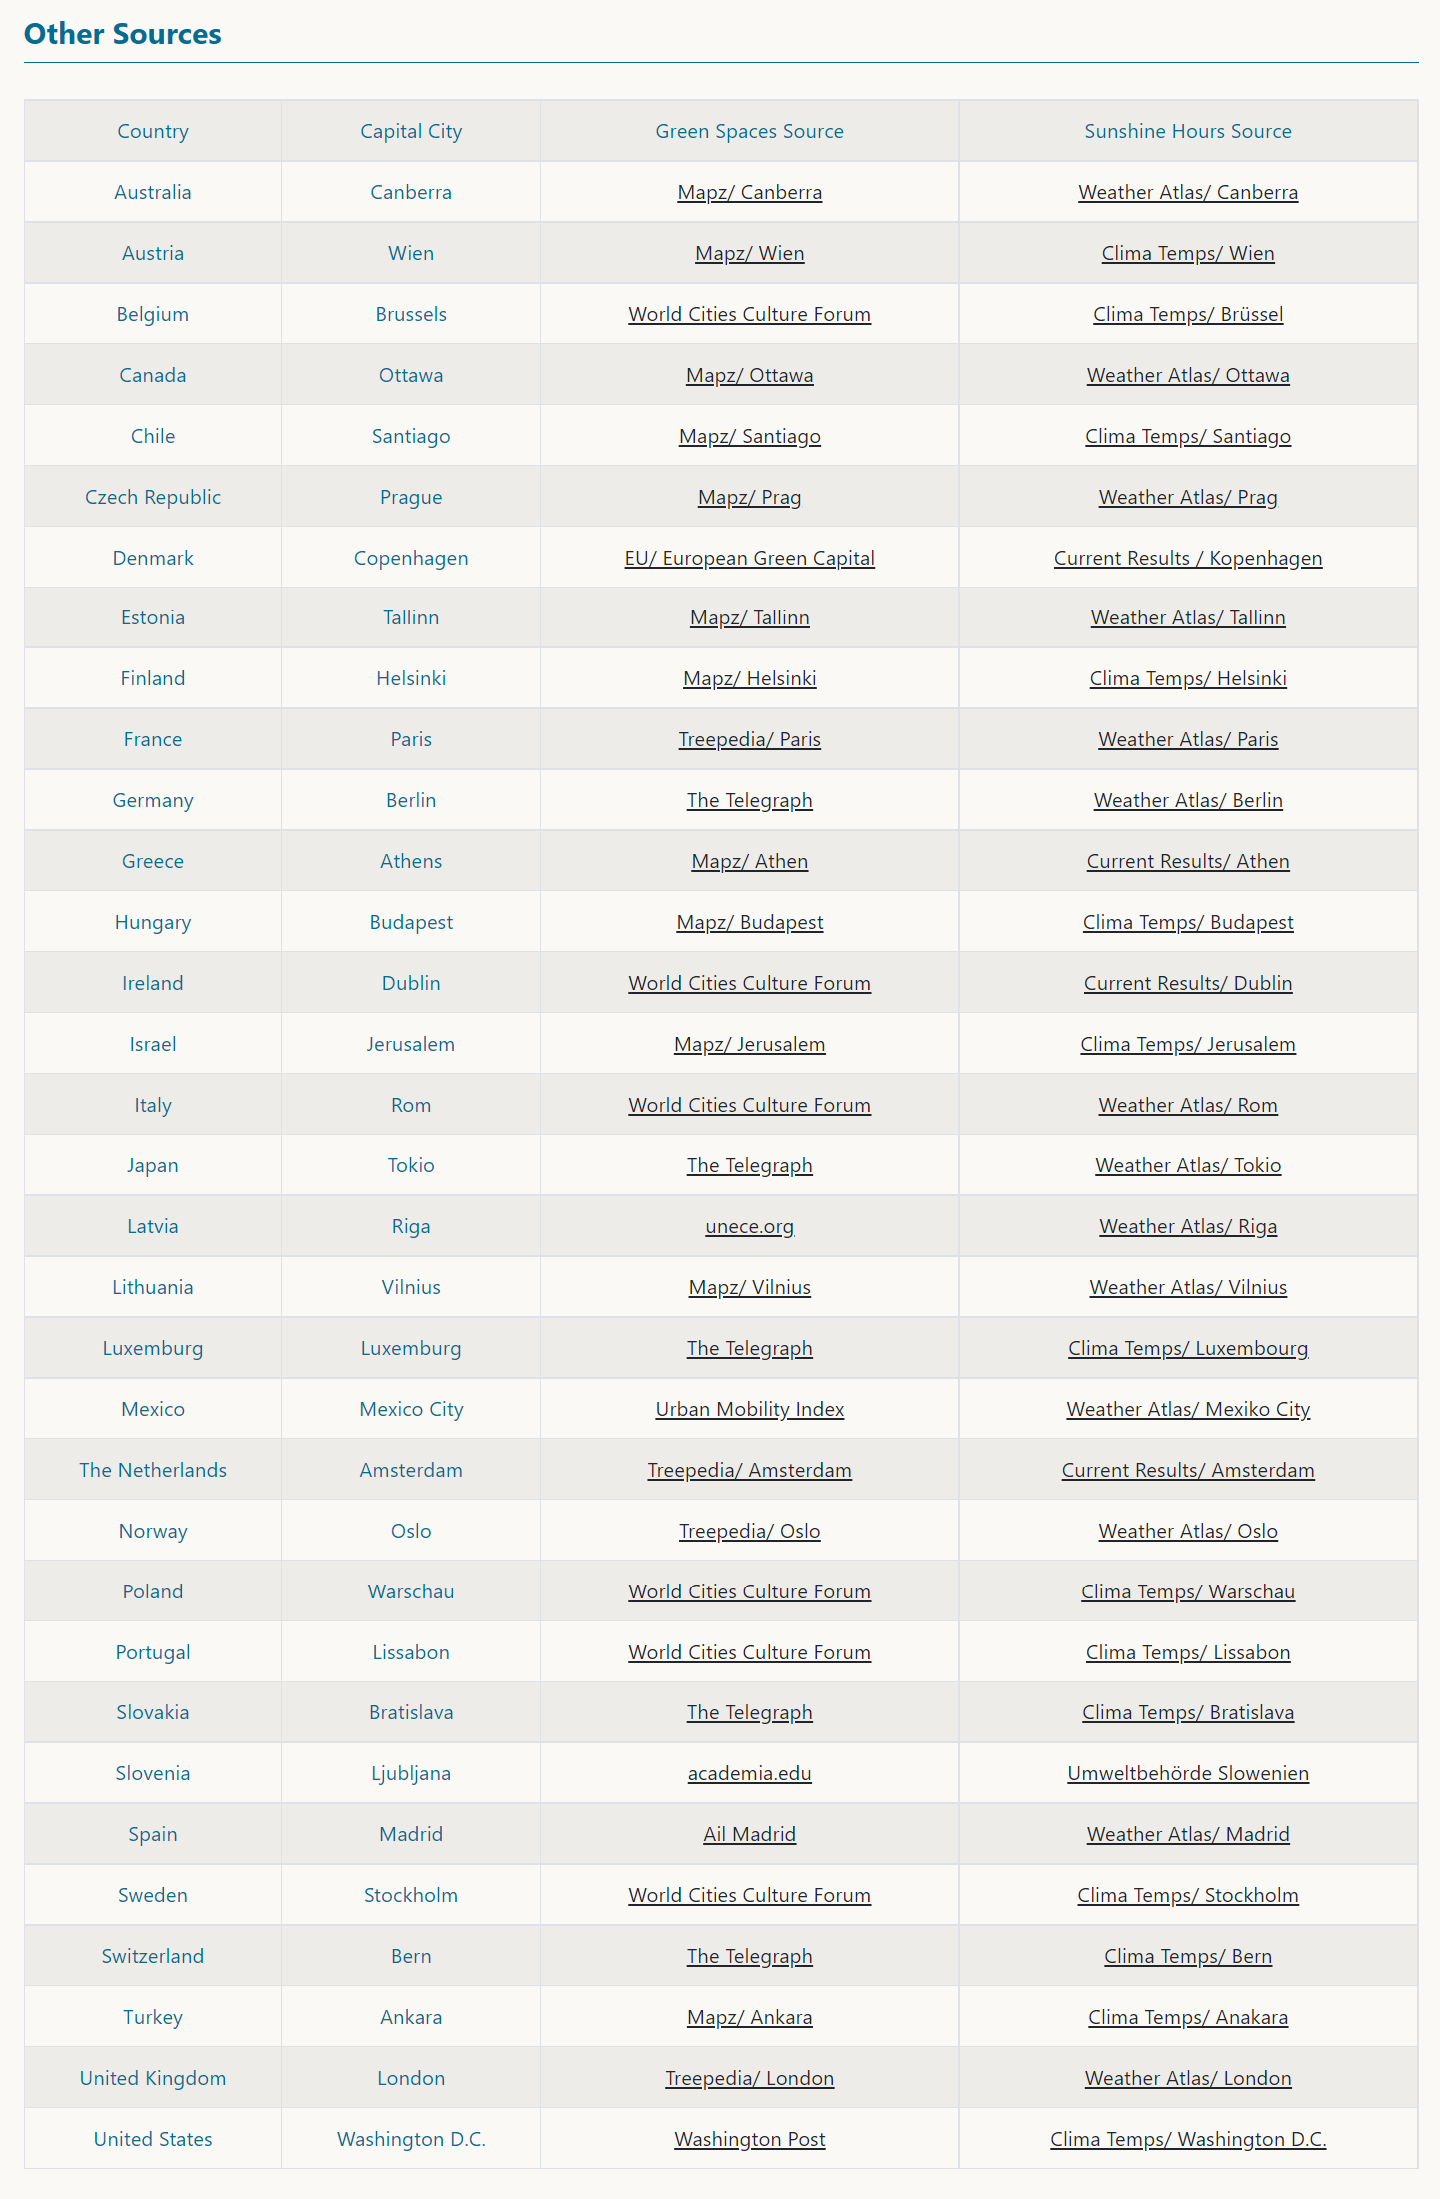
Sunlight promotes the release of the hormone serotonin, which increases our mood and helps is remain calm and focused (see “What Are the Benefits of Sunlight?”, Rachel Nall/ Heathline). Data on the annual average number of hours of sunshine was taken from various sources. All sources are listed on page 4.

Air pollution

Long-term exposure to pollutants has many negative effects, such as increased susceptibility to stress (see Adler T. A complex relationship: psychosocial stress, pollution, and health. Environ Health Perspect. 2009;117(9):A407). The data on the average fine dust pollution (PM2.5) in µg/m³ was taken from the Ambient Air Pollution Database 2016 of the World Health Organization WHO.

Green spaces

Analyses reveals a relationship between the amount of green space in a residential area and levels of stress. A higher proportion of green space is associated with less stress (see Roe JJ, Thompson CW, Aspinall PA, et al. Green space and stress: evidence from cortisol measures in deprived urban communities. Int J Environ Res Public Health. 2013;10(9):4086‐4103). The data on the percentage of green space in the city studied was taken from various sources. All sources are listed on page 4.

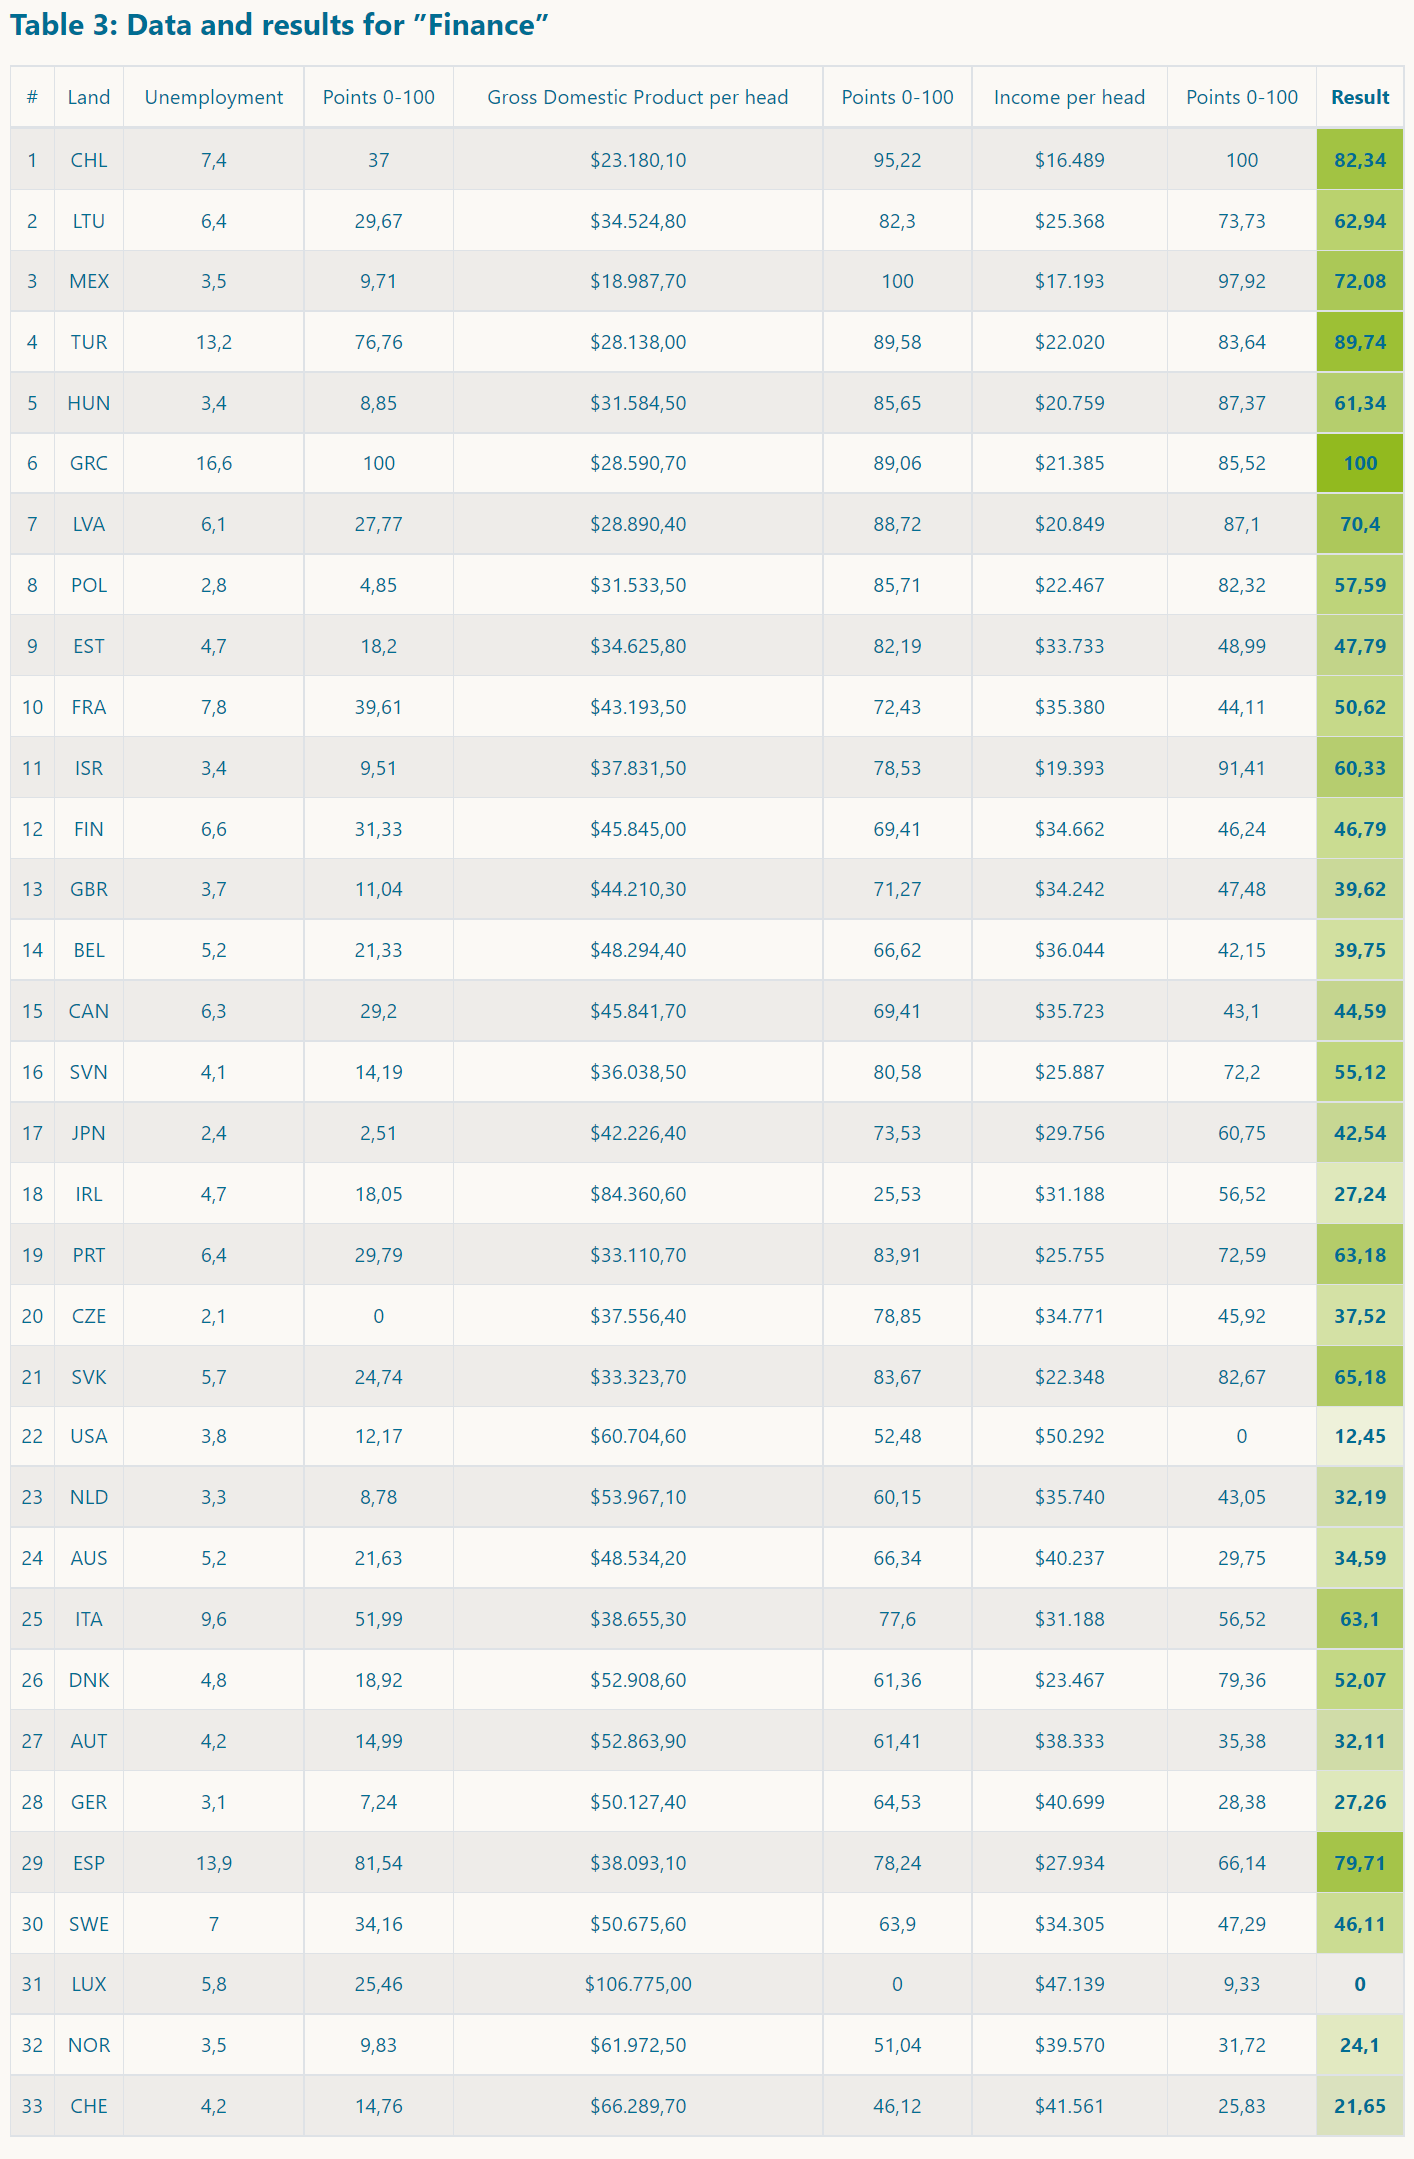
Field of investigation 3: Finances


Unemployment

Unemployment and financial insecurity can promote psychosomatic symptoms, depression and anxiety (see Linn MW, Sandifer R, Stein S. Effects of unemployment on mental and physical health. Am J Public Health. 1985;75(5):502‐506). The data on national unemployment rates for the first quarter of 2020 were taken from the unemployment statistics of the OECD data portal.

Gross Domestic Product

Gross domestic product provides information on the standard of living of a society (see “How well GDP measures the well-being of society?”: Khan Academy). The GDP per capita in US dollars was taken from the statistics "Level of GDP per capita and productivity" of the data portal OECD.stats from 2019.

Income

A low household income is associated with several lifelong mental disorders and suicide attempts. A reduction in household income is associated with an increased risk of incidents of mental disorders (see Sareen J, Afifi TO, McMillan KA, Asmundson GJG. Relationship Between Household Income and Mental Disorders: Findings From a Population-Based Longitudinal Study. Arch Gen Psychiatry. 2011;68(4):419–427). The average annual income at the national level in US dollars was taken from the statistics "Household disposable income" of the OECD data portal from 2018.

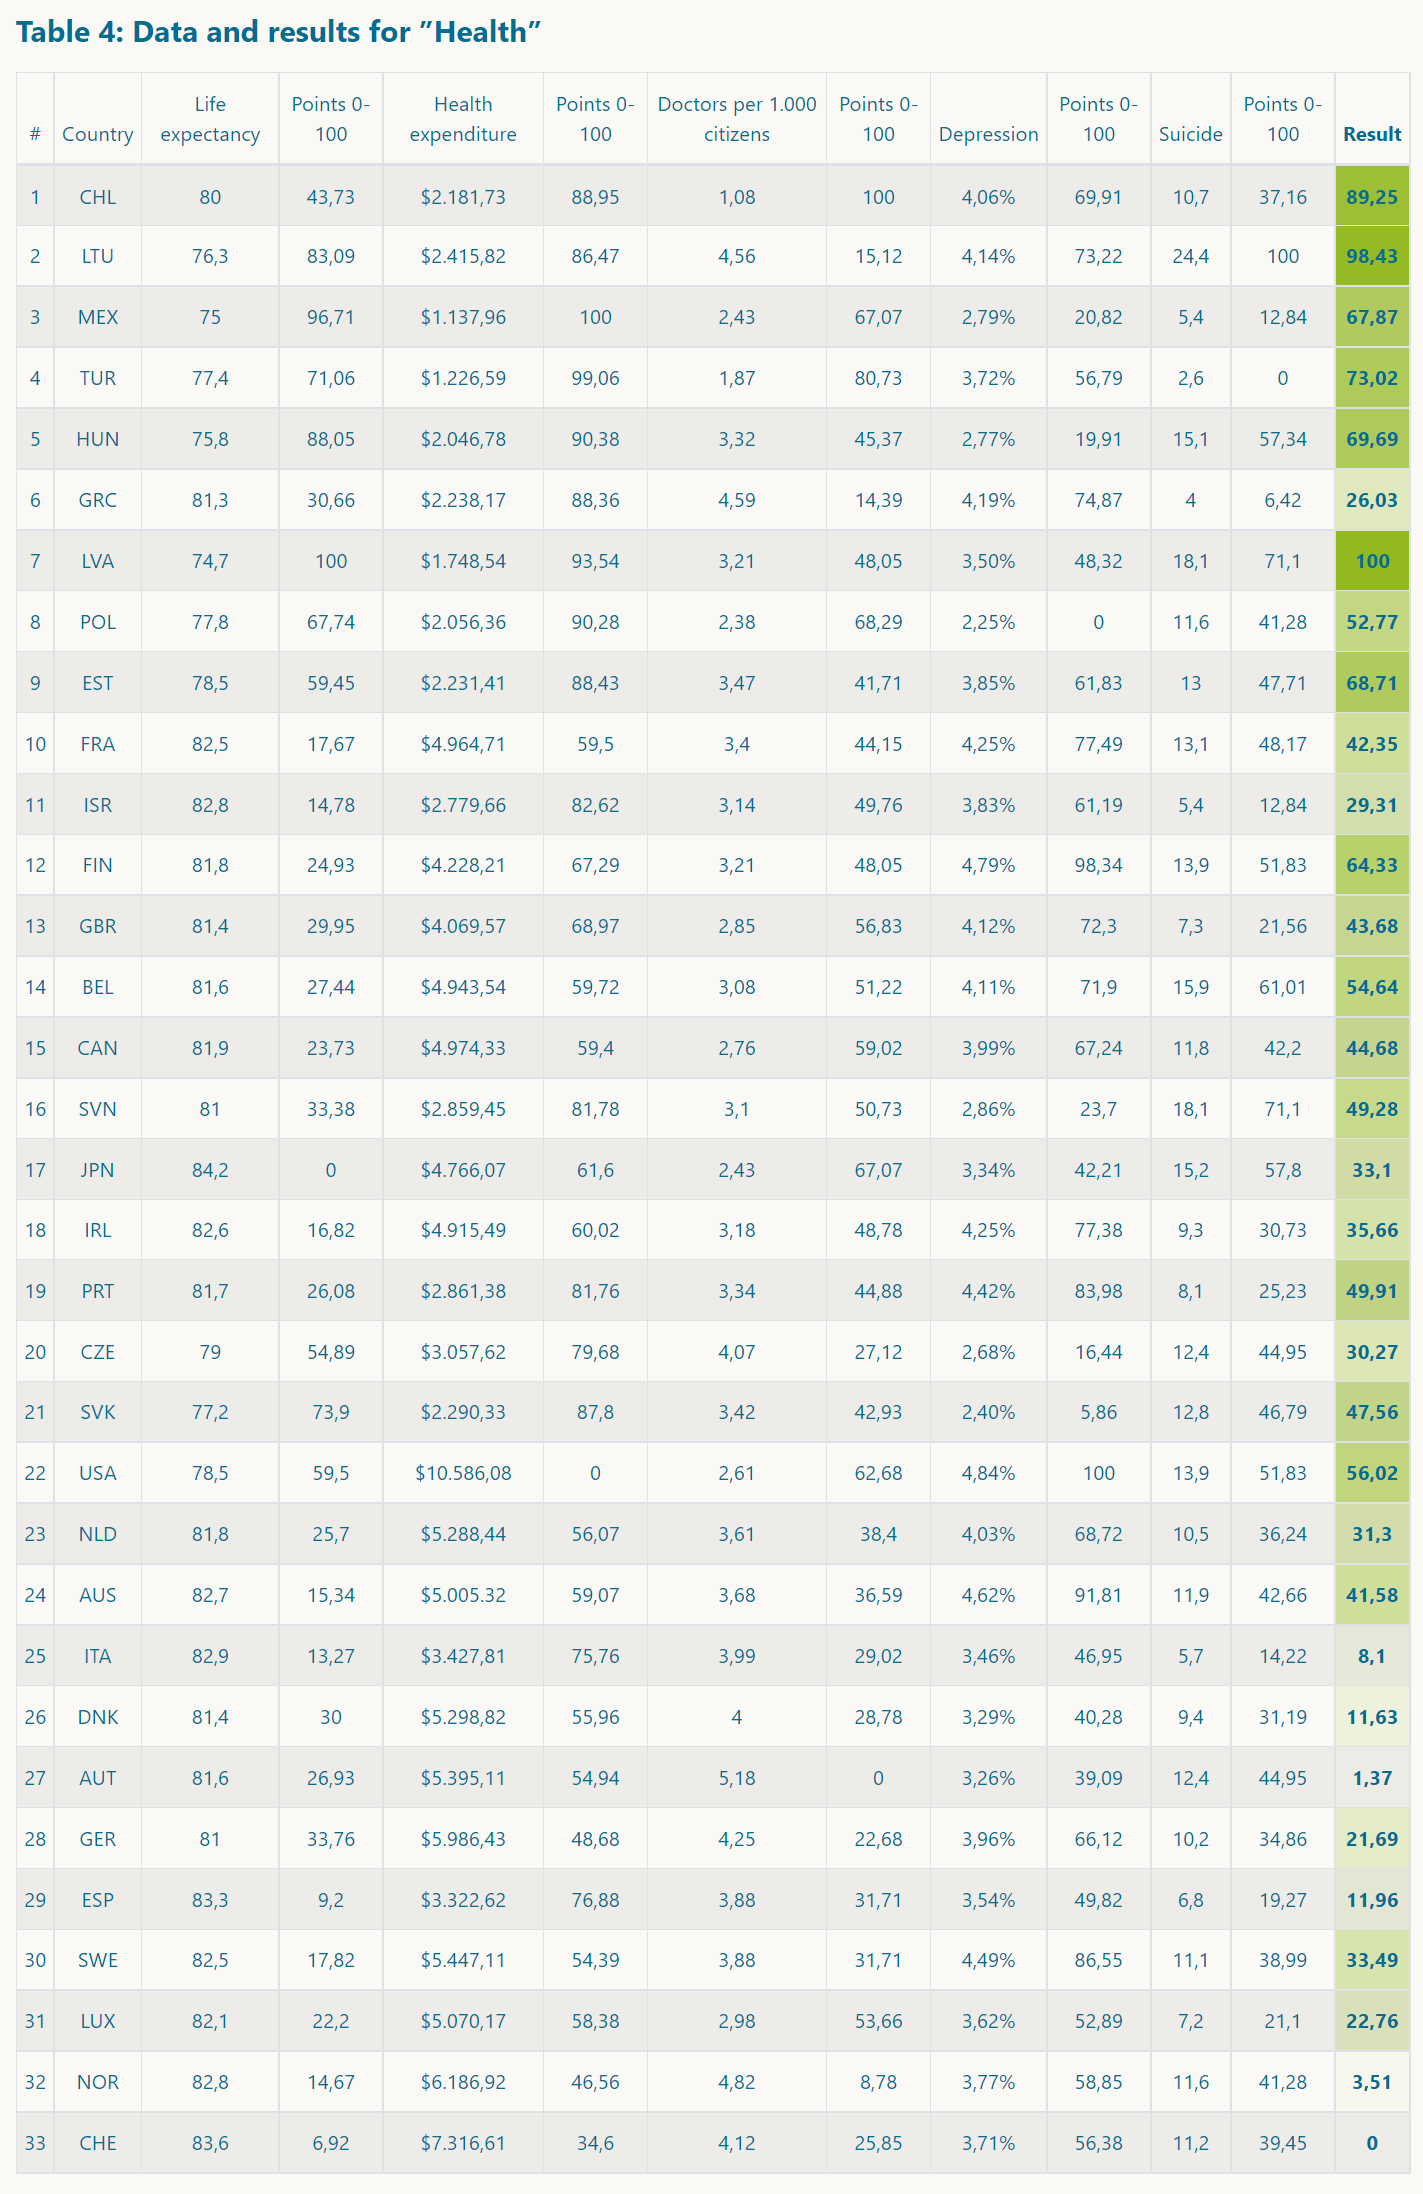
Field of investigation 4: Health


Life expectancy

Life expectancy is influenced not only by the traditional risk factors associated with lifestyle but also by factors related to a person's quality of life, such as severe stress (National Institute for Health and Welfare. "Heavy stress and lifestyle can predict how long we live." ScienceDaily. ScienceDaily, 11 March 2020). The information on average life expectancy at a national level was taken from World Bank data from 2018.

Doctors

Comprehensive medical care increases the quality of life and allows the early diagnosis and treatment of stress symptoms. The information on the number of doctors per 1,000 inhabitants was taken from the statistics on "Doctors" of the OECD data portal in 2018.

Health expenditure

Comprehensive health care improves the quality of life and allows early diagnosis and treatment of stress symptoms. The data on the level of public health expenditure per inhabitant in 2018 was taken from the statistics on "Health Spendings" of the OECD's data portal.

Depression

Environmental factors, such as stress, can be the cause of the onset of depression (see Yang L, Zhao Y, Wang Y, et al. The Effects of Psychological Stress on Depression. Curr Neuropharmacol. 2015;13(4):494‐504). The data on the percentage of the population suffering from depression was taken from Hannah Ritchie and Max Roser (2018): "Mental Health" published in Our World In Data.

Suicide

Depression is one of the most common causes of suicide (see Teismann, T., et al. Positive mental health moderates the association between depression and suicide ideation: A longitudinal study. International Journal of Clinical and Health Psychology, 2017). Environmental factors, such as stress, can be the cause of the onset of depression. The data on the national suicide rate (suicides per 100,000 inhabitants) was taken from the statistics "Suicide rates" of the OECD data portal from 2018.

Calculation


In order to enable a comparison, all the results were standardised on scale from 0 to 100. The city with the highest score in each factor received a score of 100, and the city with the lowest score in each factor received a score of 0. The result for one field of investigation was the sum of the points of all influencing factors in that field.

For example, the evaluation result for the field of investigation 1, City, was the sum of the standardised results of the influencing factors, which included: population density, rent, traffic jams, traffic accidents, and working hours. The results for each city were also standardised in order to enable comparability between the cities.

The following normalisation formula was used for the standardisations:

Formel Normalisierung

Data and partial results


Table 1: Data and results for “City”

# Country Population Density Points 0-100 Rent Points 0-100 Traffic congestion Points 0-100 Traffic accidents Points 0-100 Working hours Points 0-100 Result
1 CHL 5.201 71,73 388,90 € 10,44 44% 77,14 12,4 0,0 37,9 68,82 60,07
2 LTU 1.752 22,96 511,75 € 16,89 32% 42,86 67,5 54,18 35,4 54,39 44,56
3 MEX 4.445 61,04 524,21 € 17,55 52% 100,0 22,6 10,03 43,2 100,0 85,52
4 TUR 205 1,09 190,16 € 0,0 32% 42,86 92,0 78,27 35,1 53,06 37,83
5 HUN 466 4,78 474,44 € 14,93 37% 57,14 63,9 50,64 37,2 64,75 44,97
6 GRC 1.833 24,11 410,34 € 11,57 43% 74,29 68,0 54,67 38,7 73,58 64,31
7 LVA 152 0,34 420,68 € 12,11 27% 28,57 70,1 56,74 36,0 57,79 29,53
8 POL 370 3,42 637,16 € 23,48 40% 65,71 74,5 61,06 38,9 74,86 60,24
9 EST 3.713 50,69 541,02 € 18,43 31% 40,0 36,5 23,7 35,6 55,8 43,44
10 FRA 734 8,57 1168,35 € 51,38 39% 62,86 51,4 38,35 29,0 17,78 39,37
11 ISR 7.200 100,0 987,36 € 41,88 50% 94,29 36,8 23,99 36,8 62,89 100,00
12 FIN 318 2,69 1002,56 € 42,68 19% 5,71 41,7 28,81 31,8 33,89 11,96
13 GBR 1.785 23,43 1975,81 € 93,8 23% 17,14 28,1 15,44 32 35,11 41,89
14 BEL 552 6,00 858,33 € 35,1 38% 60,00 54,1 41,00 29,6 21,13 32,76
15 CAN 128 0,00 994,69 € 42,26 39% 62,86 52,3 39,23 32,5 38,02 40,81
16 SVN 1.752 22,96 594,43 € 21,24 26% 25,71 50,3 37,27 31,7 33,43 23,24
17 JPN 3.198 43,41 1047,64 € 45,04 42% 71,43 34,9 22,12 33,3 42,67 58,61
18 IRL 278 2,12 1713,36 € 80,01 48% 88,57 32,6 19,86 33,5 43,48 62,56
19 PRT 689 7,93 899,76 € 37,28 33% 45,71 54,5 41,40 35,7 56,52 43,53
20 CZE 385 3,63 778,04 € 30,88 29% 34,29 54,5 41,40 34,1 46,86 30,16
21 SVK 1.772 23,25 619,14 € 22,53 36% 54,29 50,7 37,66 33,5 43,43 40,3
22 USA 383 3,61 2093,83 € 100 29% 34,29 114,1 100,00 33,7 44,76 83
23 NLD 836 10,01 1606,07 € 74,38 26% 25,71 35,8 23,01 27,4 8,45 23,64
24 AUS 178 0,71 1203,99 € 53,26 17% 0,00 53,5 40,41 33,2 41,9 21,42
25 ITA 719 8,36 938,21 € 39,3 38% 60,00 55,8 42,67 33 40,92 44,55
26 DNK 594 6,59 1338,04 € 60,3 22% 14,29 36,8 23,99 26,9 5,16 10,5
27 AUT 309 2,56 880,91 € 36,29 28% 31,43 49,4 36,38 30,9 28,76 21,06
28 GER 301 2,45 912,33 € 37,94 32% 42,86 38,5 25,66 26 0,00 9,9
29 ESP 862 10,38 990,15 € 42,02 23% 17,14 38,9 26,06 32,3 36,91 19,84
30 SWE 327 2,81 1251 € 55,73 27% 28,57 25,1 12,49 30,9 28,34 17,91
31 LUX 232 1,47 1561,54 € 72,04 36% 54,29 63,2 49,95 29,1 18,31 46,57
32 NOR 186 0,82 1249,14 € 55,63 22% 14,29 20,1 7,57 27,2 7,06 0,00
33 CHE 536 5,77 1068,93 € 46,16 20% 8,57 27,2 14,55 30,5 26,17 6,67

Table 2: Data and results for ”Environment”

# Country Sunshine hours Points 0-100 Air pollution (µg/m³) Points 0-100 Green spaces Points 0-100 Result
1 CHL 2.462 49,22 96 100 9,00% 78,24 96,11
2 LTU 1.588 91,98 47 43,68 0,90% 98,04 100
3 MEX 2.615 41,73 61 59,77 4,00% 90,46 73,99
4 TUR 2.747 35,27 47 43,68 0,10% 100 65,87
5 HUN 1.988 72,41 51 48,28 2,90% 93,15 87,62
6 GRC 2.771 34,1 61 59,77 4,80% 88,51 68,01
7 LVA 1.760 83,56 41 36,78 23,80% 42,05 55,55
8 POL 1.676 87,67 55 52,87 17,00% 58,68 78,51
9 EST 1.826 80,33 17 9,2 2,40% 94,38 68,96
10 FRA 1.670 87,96 44 40,23 8,80% 78,73 83,31
11 ISR 3.468 0 19 11,49 4,40% 89,49 17,27
12 FIN 1.802 81,51 28 21,84 3,80% 90,95 75,44
13 GBR 1.650 88,94 37 32,18 12,70% 69,19 72,96
14 BEL 1.585 92,12 44 40,23 18,80% 54,28 70,66
15 CAN 2.010 71,33 18 10,34 1,40% 96,82 65,59
16 SVN 1.832 80,04 49 45,98 27,90% 32,03 52,84
17 JPN 1.870 78,18 53 50,57 34,50% 15,89 44,49
18 IRL 1.424 100 22 14,94 26,00% 36,67 48,83
19 PRT 3.023 21,77 38 33,33 22,00% 46,45 17,63
20 CZE 1.668 88,06 40 35,63 11,70% 71,64 76,08
21 SVK 2.042 69,77 37 32,18 41,00% 0 17,87
22 USA 2.601 42,42 9 0 20,00% 51,34 12,77
23 NLD 1.662 88,36 34 28,74 20,60% 49,88 58,4
24 AUS 2.815 31,95 17 9,2 8,50% 79,46 29,5
25 ITA 2.500 47,36 42 37,93 38,90% 5,13 10,69
26 DNK 1.780 82,58 36 31,03 25,00% 39,12 49,53
27 AUT 1.891 77,15 31 25,29 8,90% 78,48 67,1
28 GER 1.630 89,92 39 34,48 21,10% 48,66 62,2
29 ESP 2.740 35,62 29 22,99 35,00% 14,67 0
30 SWE 1.973 73,14 25 18,39 40,00% 2,44 12,9
31 LUX 1.487 96,92 16 8,05 38,00% 7,33 24,33
32 NOR 1.668 88,06 27 20,69 28,80% 29,83 40,71
33 CHE 1.756 83,76 16 8,05 32,80% 20,15 24,11

Table 3: Data and results for ”Finance”

# Land Unemployment Points 0-100 Gross Domestic Product per head Points 0-100 Income per head Points 0-100 Result
1 CHL 7,4 37 $23.180,10 95,22 $16.489 100 82,34
2 LTU 6,4 29,67 $34.524,80 82,3 $25.368 73,73 62,94
3 MEX 3,5 9,71 $18.987,70 100 $17.193 97,92 72,08
4 TUR 13,2 76,76 $28.138,00 89,58 $22.020 83,64 89,74
5 HUN 3,4 8,85 $31.584,50 85,65 $20.759 87,37 61,34
6 GRC 16,6 100 $28.590,70 89,06 $21.385 85,52 100
7 LVA 6,1 27,77 $28.890,40 88,72 $20.849 87,1 70,4
8 POL 2,8 4,85 $31.533,50 85,71 $22.467 82,32 57,59
9 EST 4,7 18,2 $34.625,80 82,19 $33.733 48,99 47,79
10 FRA 7,8 39,61 $43.193,50 72,43 $35.380 44,11 50,62
11 ISR 3,4 9,51 $37.831,50 78,53 $19.393 91,41 60,33
12 FIN 6,6 31,33 $45.845,00 69,41 $34.662 46,24 46,79
13 GBR 3,7 11,04 $44.210,30 71,27 $34.242 47,48 39,62
14 BEL 5,2 21,33 $48.294,40 66,62 $36.044 42,15 39,75
15 CAN 6,3 29,2 $45.841,70 69,41 $35.723 43,1 44,59
16 SVN 4,1 14,19 $36.038,50 80,58 $25.887 72,2 55,12
17 JPN 2,4 2,51 $42.226,40 73,53 $29.756 60,75 42,54
18 IRL 4,7 18,05 $84.360,60 25,53 $31.188 56,52 27,24
19 PRT 6,4 29,79 $33.110,70 83,91 $25.755 72,59 63,18
20 CZE 2,1 0 $37.556,40 78,85 $34.771 45,92 37,52
21 SVK 5,7 24,74 $33.323,70 83,67 $22.348 82,67 65,18
22 USA 3,8 12,17 $60.704,60 52,48 $50.292 0 12,45
23 NLD 3,3 8,78 $53.967,10 60,15 $35.740 43,05 32,19
24 AUS 5,2 21,63 $48.534,20 66,34 $40.237 29,75 34,59
25 ITA 9,6 51,99 $38.655,30 77,6 $31.188 56,52 63,1
26 DNK 4,8 18,92 $52.908,60 61,36 $23.467 79,36 52,07
27 AUT 4,2 14,99 $52.863,90 61,41 $38.333 35,38 32,11
28 GER 3,1 7,24 $50.127,40 64,53 $40.699 28,38 27,26
29 ESP 13,9 81,54 $38.093,10 78,24 $27.934 66,14 79,71
30 SWE 7 34,16 $50.675,60 63,9 $34.305 47,29 46,11
31 LUX 5,8 25,46 $106.775,00 0 $47.139 9,33 0
32 NOR 3,5 9,83 $61.972,50 51,04 $39.570 31,72 24,1
33 CHE 4,2 14,76 $66.289,70 46,12 $41.561 25,83 21,65

Table 4: Data and results for ”Health”

# Country Life expectancy Points 0-100 Health expenditure Points 0-100 Doctors per 1.000 citizens Points 0-100 Depression Points 0-100 Suicide Points 0-100 Result
1 CHL 80 43,73 $2.181,73 88,95 1,08 100 4,06% 69,91 10,7 37,16 89,25
2 LTU 76,3 83,09 $2.415,82 86,47 4,56 15,12 4,14% 73,22 24,4 100 98,43
3 MEX 75 96,71 $1.137,96 100 2,43 67,07 2,79% 20,82 5,4 12,84 67,87
4 TUR 77,4 71,06 $1.226,59 99,06 1,87 80,73 3,72% 56,79 2,6 0 73,02
5 HUN 75,8 88,05 $2.046,78 90,38 3,32 45,37 2,77% 19,91 15,1 57,34 69,69
6 GRC 81,3 30,66 $2.238,17 88,36 4,59 14,39 4,19% 74,87 4 6,42 26,03
7 LVA 74,7 100 $1.748,54 93,54 3,21 48,05 3,50% 48,32 18,1 71,1 100
8 POL 77,8 67,74 $2.056,36 90,28 2,38 68,29 2,25% 0 11,6 41,28 52,77
9 EST 78,5 59,45 $2.231,41 88,43 3,47 41,71 3,85% 61,83 13 47,71 68,71
10 FRA 82,5 17,67 $4.964,71 59,5 3,4 44,15 4,25% 77,49 13,1 48,17 42,35
11 ISR 82,8 14,78 $2.779,66 82,62 3,14 49,76 3,83% 61,19 5,4 12,84 29,31
12 FIN 81,8 24,93 $4.228,21 67,29 3,21 48,05 4,79% 98,34 13,9 51,83 64,33
13 GBR 81,4 29,95 $4.069,57 68,97 2,85 56,83 4,12% 72,3 7,3 21,56 43,68
14 BEL 81,6 27,44 $4.943,54 59,72 3,08 51,22 4,11% 71,9 15,9 61,01 54,64
15 CAN 81,9 23,73 $4.974,33 59,4 2,76 59,02 3,99% 67,24 11,8 42,2 44,68
16 SVN 81 33,38 $2.859,45 81,78 3,1 50,73 2,86% 23,7 18,1 71,1 49,28
17 JPN 84,2 0 $4.766,07 61,6 2,43 67,07 3,34% 42,21 15,2 57,8 33,1
18 IRL 82,6 16,82 $4.915,49 60,02 3,18 48,78 4,25% 77,38 9,3 30,73 35,66
19 PRT 81,7 26,08 $2.861,38 81,76 3,34 44,88 4,42% 83,98 8,1 25,23 49,91
20 CZE 79 54,89 $3.057,62 79,68 4,07 27,12 2,68% 16,44 12,4 44,95 30,27
21 SVK 77,2 73,9 $2.290,33 87,8 3,42 42,93 2,40% 5,86 12,8 46,79 47,56
22 USA 78,5 59,5 $10.586,08 0 2,61 62,68 4,84% 100 13,9 51,83 56,02
23 NLD 81,8 25,7 $5.288,44 56,07 3,61 38,4 4,03% 68,72 10,5 36,24 31,3
24 AUS 82,7 15,34 $5.005.32 59,07 3,68 36,59 4,62% 91,81 11,9 42,66 41,58
25 ITA 82,9 13,27 $3.427,81 75,76 3,99 29,02 3,46% 46,95 5,7 14,22 8,1
26 DNK 81,4 30 $5.298,82 55,96 4 28,78 3,29% 40,28 9,4 31,19 11,63
27 AUT 81,6 26,93 $5.395,11 54,94 5,18 0 3,26% 39,09 12,4 44,95 1,37
28 GER 81 33,76 $5.986,43 48,68 4,25 22,68 3,96% 66,12 10,2 34,86 21,69
29 ESP 83,3 9,2 $3.322,62 76,88 3,88 31,71 3,54% 49,82 6,8 19,27 11,96
30 SWE 82,5 17,82 $5.447,11 54,39 3,88 31,71 4,49% 86,55 11,1 38,99 33,49
31 LUX 82,1 22,2 $5.070,17 58,38 2,98 53,66 3,62% 52,89 7,2 21,1 22,76
32 NOR 82,8 14,67 $6.186,92 46,56 4,82 8,78 3,77% 58,85 11,6 41,28 3,51
33 CHE 83,6 6,92 $7.316,61 34,6 4,12 25,85 3,71% 56,38 11,2 39,45 0

Table 5: Final data (aggregated)

# Country City Environment Finance Health Summary
1 CHL 60,07 96,11 82,34 89,25 100
2 LTU 44,56 100 62,94 98,43 92,07
3 MEX 85,52 73,99 72,08 67,87 89,72
4 TUR 37,83 65,87 89,74 73,02 77,73
5 HUN 44,97 87,62 61,34 69,69 76,7
6 GRC 64,31 68,01 100 26,03 74,79
7 LVA 29,53 55,55 70,4 100 73,74
8 POL 60,24 78,51 57,59 52,77 71,43
9 EST 43,44 68,96 47,79 68,71 64,09
10 FRA 39,37 83,31 50,62 42,35 59,28
11 ISR 100 17,27 60,33 29,31 56,1
12 FIN 11,96 75,44 46,79 64,33 53,05
13 GBR 41,89 72,96 39,62 43,68 52,92
14 BEL 32,76 70,66 39,75 54,64 52,8
15 CAN 40,81 65,59 44,59 44,68 52,03
16 SVN 23,24 52,84 55,12 49,28 46,51
17 JPN 58,61 44,49 42,54 33,1 45,87
18 IRL 62,56 48,83 27,24 35,66 44,26
19 PRT 43,53 17,63 63,18 49,91 44,24
20 CZE 30,16 76,08 37,52 30,27 44,17
21 SVK 40,3 17,87 65,18 47,56 43,03
22 USA 83 12,77 12,45 56,02 40,61
23 NLD 23,64 58,4 32,19 31,3 33,82
24 AUS 21,42 29,5 34,59 41,58 27,12
25 ITA 44,55 10,69 63,1 8,1 26,88
26 DNK 10,5 49,53 52,07 11,63 25,9
27 AUT 21,06 67,1 32,11 1,37 25,13
28 GER 9,9 62,2 27,26 21,69 24,92
29 ESP 19,84 0 79,71 11,96 21,45
30 SWE 17,91 12,9 46,11 33,49 21,06
31 LUX 46,57 24,33 0 22,76 14,97
32 NOR 0 40,71 24,1 3,51 5,77
33 CHE 6,67 24,11 21,65 0 0

Other Sources


Country Capital City Green Spaces Source Sunshine Hours Source
Australia Canberra Mapz/ Canberra Weather Atlas/ Canberra
Austria Wien Mapz/ Wien Clima Temps/ Wien
Belgium Brussels World Cities Culture Forum Clima Temps/ Brüssel
Canada Ottawa Mapz/ Ottawa Weather Atlas/ Ottawa
Chile Santiago Mapz/ Santiago Clima Temps/ Santiago
Czech Republic Prague Mapz/ Prag Weather Atlas/ Prag
Denmark Copenhagen EU/ European Green Capital Current Results / Kopenhagen
Estonia Tallinn Mapz/ Tallinn Weather Atlas/ Tallinn
Finland Helsinki Mapz/ Helsinki Clima Temps/ Helsinki
France Paris Treepedia/ Paris Weather Atlas/ Paris
Germany Berlin The Telegraph Weather Atlas/ Berlin
Greece Athens Mapz/ Athen Current Results/ Athen
Hungary Budapest Mapz/ Budapest Clima Temps/ Budapest
Ireland Dublin World Cities Culture Forum Current Results/ Dublin
Israel Jerusalem Mapz/ Jerusalem Clima Temps/ Jerusalem
Italy Rom World Cities Culture Forum Weather Atlas/ Rom
Japan Tokio The Telegraph Weather Atlas/ Tokio
Latvia Riga unece.org Weather Atlas/ Riga
Lithuania Vilnius Mapz/ Vilnius Weather Atlas/ Vilnius
Luxemburg Luxemburg The Telegraph Clima Temps/ Luxembourg
Mexico Mexico City Urban Mobility Index Weather Atlas/ Mexiko City
The Netherlands Amsterdam Treepedia/ Amsterdam Current Results/ Amsterdam
Norway Oslo Treepedia/ Oslo Weather Atlas/ Oslo
Poland Warschau World Cities Culture Forum Clima Temps/ Warschau
Portugal Lissabon World Cities Culture Forum Clima Temps/ Lissabon
Slovakia Bratislava The Telegraph Clima Temps/ Bratislava
Slovenia Ljubljana academia.edu Umweltbehörde Slowenien
Spain Madrid Ail Madrid Weather Atlas/ Madrid
Sweden Stockholm World Cities Culture Forum Clima Temps/ Stockholm
Switzerland Bern The Telegraph Clima Temps/ Bern
Turkey Ankara Mapz/ Ankara Clima Temps/ Anakara
United Kingdom London Treepedia/ London Weather Atlas/ London
United States Washington D.C. Washington Post Clima Temps/ Washington D.C.